Bar Chart Generator
Create professional bar charts online with our free bar chart generator. Design custom bar charts with multiple data categories, colors, and export options.
Add Data Categories
| Category Label | Value | Color | Actions |
|---|---|---|---|
  ┌─ Bar Chart Preview ─┐
  │                     │
  │   📊 Add data       │
  │   categories and    │
  │   generate your     │
  │   bar chart!        │
  │                     │
  └─────────────────────┘
About Our Bar Chart Generator
Create stunning bar charts online with our free bar chart generator tool. Design professional bar charts with custom categories, values, and colors. Perfect for data visualization, presentations, reports, and statistical analysis. Generate interactive bar charts and export them as high-quality images.
Step-by-Step Bar Chart Creation:
- Enter a descriptive title for your bar chart
- Add labels for X-axis and Y-axis with units if needed
- Use "Add Category" to insert data categories
- Enter category names and corresponding numerical values
- Customize colors for each bar using the color picker
- Click "Generate Bar Chart" to create your visualization
- Download your bar chart as a high-quality PNG image
Professional Chart Features:
- Unlimited data categories for complex datasets
- Custom color selection for each bar
- Interactive tooltips with precise values
- Smooth animations and transitions
- Responsive design that works on all devices
- Professional typography and styling
Data Input Options:
- Support for decimal and integer values
- Easy category management (add/remove)
- Visual color picker interface
- Real-time data validation
- Customizable axis labels and chart titles
Educational Applications:
- Student research projects and data visualization
- Science experiment results and analysis
- Survey data presentation and statistics
- Mathematical exercises and graph interpretation
Business Intelligence:
- Sales performance tracking and comparison
- Financial reports and budget visualization
- Market research data presentation
- KPI dashboards and metric tracking
Personal Data Visualization:
- Fitness progress and health metrics
- Personal budget and expense tracking
- Hobby statistics and comparisons
- Goal achievement and progress monitoring
📊 Is this bar chart generator free to use?
Yes! Our bar chart generator is completely free with no limitations on the number of categories or charts you can create.
🎨 Can I customize bar chart colors?
Absolutely! Each data category has its own color picker, allowing you to create visually appealing bar charts that match your brand or preferences.
💾 What formats can I export bar charts in?
Bar charts are exported as high-quality PNG images, perfect for presentations, reports, and web content.
📱 Does the bar chart generator work on mobile?
Yes! Our bar chart generator is fully responsive and works seamlessly on smartphones, tablets, and desktop computers.
🔢 How many data points can I add?
There's no limit! Add as many data categories as you need for comprehensive bar chart visualization.
🔄 Can I edit my bar chart after creation?
Yes! You can modify categories, values, colors, and labels at any time, then regenerate your bar chart instantly.
Related Tools
You might also find these useful
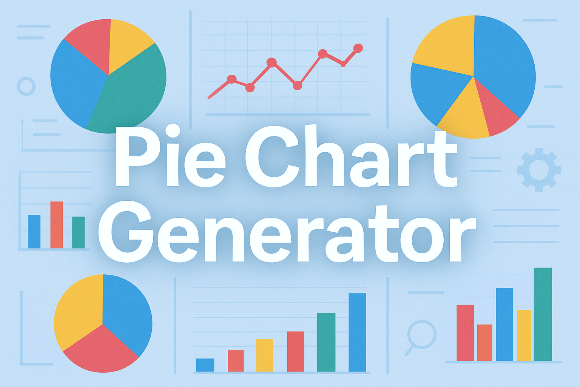
Pie Chart Generator
Create pie charts with this free online tool. Perfect for creating beautiful charts and graphs.

HEIC to JPEG Converter
Convert HEIC/HEIF images to JPEG format online. Fast, free, and private conversion for Apple iPhone photos with smaller file sizes.
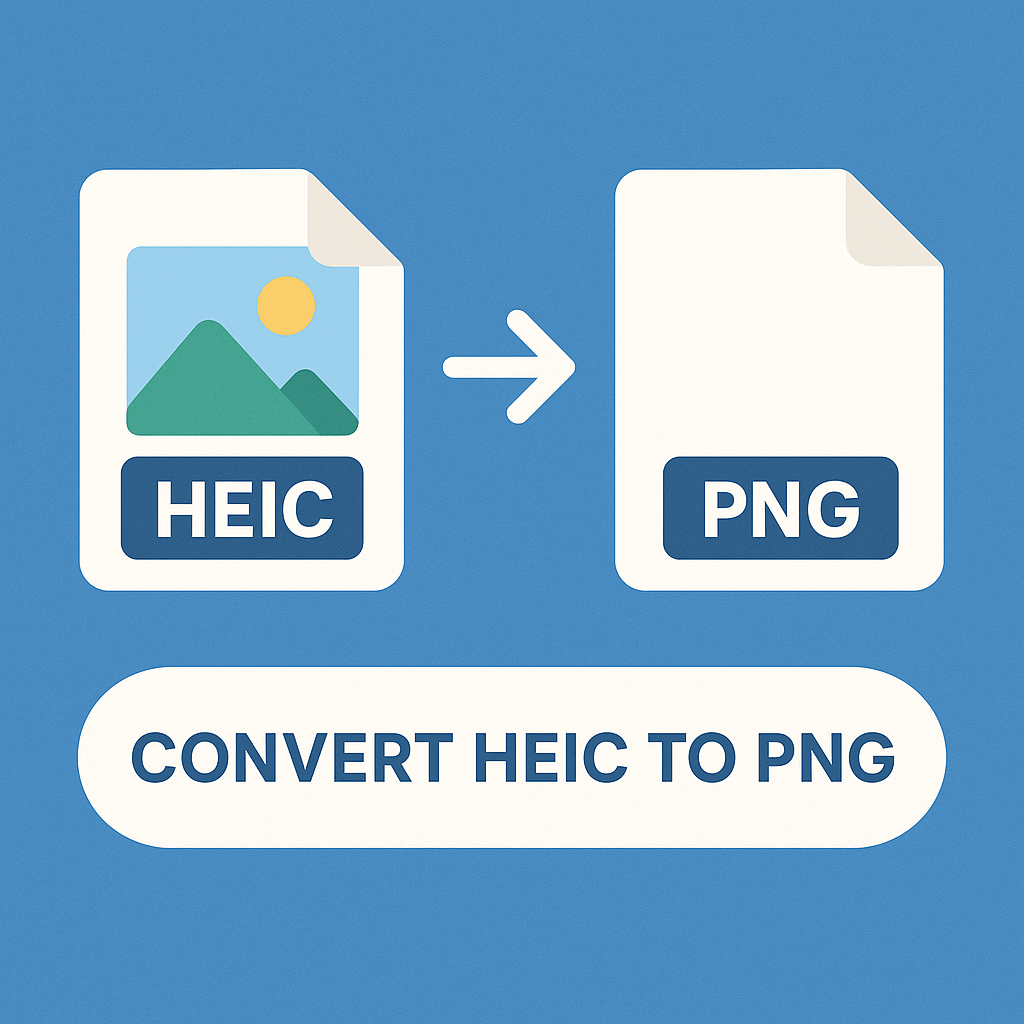
HEIC to PNG Converter
Convert HEIC/HEIF images to PNG format with lossless quality. Free online converter for Apple photos with transparency support.

Convert Picture to Black and White
Convert pictures to black and white with this free online tool. Perfect for creating beautiful black and white images.
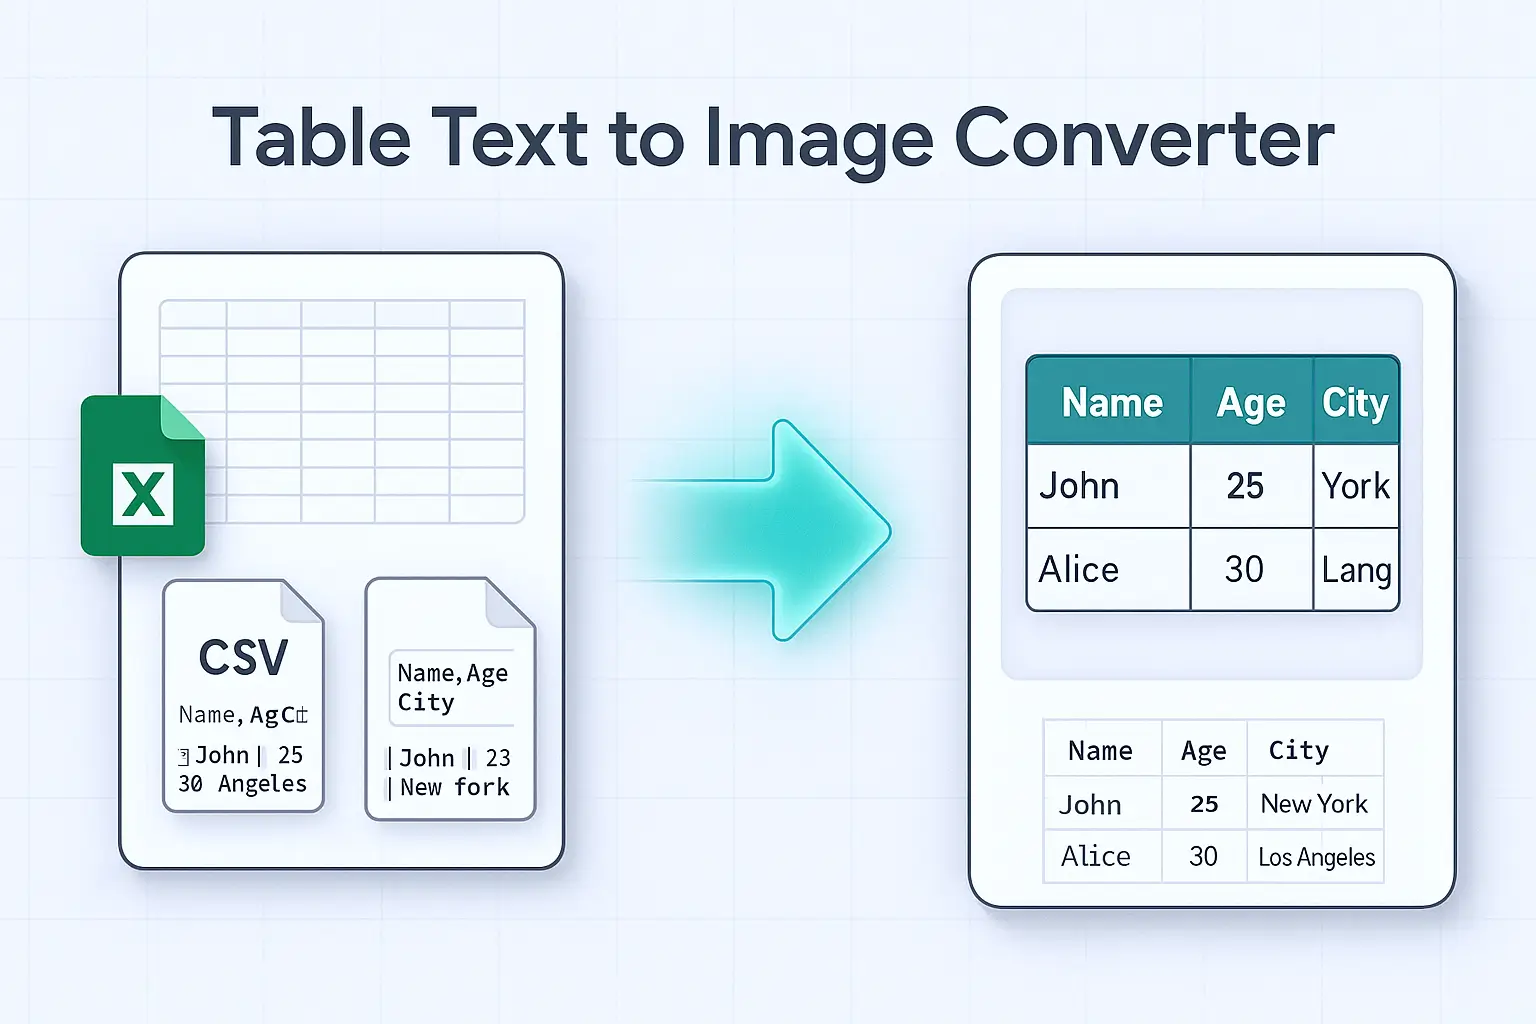
Table Text to Image
Convert text tables to images with this free online tool. Perfect for creating beautiful images of your data.

Shrug Emoji Generator
Generate shrug emoji ¯_(ツ)_/¯ in different fonts and styles.