Pie Chart Generator
Create beautiful and interactive pie charts online. Generate customizable pie charts with your data, choose colors, and export as images or SVG.
  ┌─ Pie Chart ─┐
  │             │
  │   📊 Add    │
  │   data to   │
  │   generate  │
  │   chart     │
  │             │
  └─────────────┘
About Pie Chart Generator
Create beautiful and customizable pie charts with your data. Perfect for visualizing proportional data, survey results, budget breakdowns, and statistical information in an easy-to-understand format.
Step-by-Step Guide:
- Add data items by clicking "Add Data Item"
- Enter labels and values for each data point
- Choose colors by clicking the color picker
- Customize chart settings (title, size, labels)
- Download your chart as PNG or SVG
Customization Options:
- Custom colors for each data segment
- Adjustable chart size (300px - 1024px)
- Optional labels and percentages
- Chart title customization
- Legend display toggle
- High-quality PNG and SVG export
Business & Finance:
- Budget allocation visualization
- Market share analysis
- Revenue breakdown by department
- Expense category distribution
Education & Research:
- Survey result presentation
- Demographic data visualization
- Student performance distribution
- Research findings illustration
Marketing & Analytics:
- Website traffic source breakdown
- Customer segment analysis
- Campaign performance visualization
- Social media engagement metrics
📊 What file formats can I export?
You can export your pie charts as PNG images for presentations or SVG files for web use and vector graphics.
🎨 Can I customize the colors?
Yes! Each data segment can have its own custom color. Click on the color picker next to each data item to choose your preferred colors.
📏 What size are the charts?
All charts are generated at 600x600 pixels, providing high quality for both viewing and exporting.
🔢 How are percentages calculated?
Percentages are automatically calculated based on each value relative to the total sum of all values in your dataset.
💾 Is my data saved?
Data is temporarily stored in your browser while you work, but it's not saved permanently. Export your charts when finished.
Related Tools
You might also find these useful

Bar Chart Generator
Create bar charts with this free online tool. Perfect for creating beautiful charts and graphs.

HEIC to JPEG Converter
Convert HEIC/HEIF images to JPEG format online. Fast, free, and private conversion for Apple iPhone photos with smaller file sizes.

HEIC to PNG Converter
Convert HEIC/HEIF images to PNG format with lossless quality. Free online converter for Apple photos with transparency support.

Convert Picture to Black and White
Convert pictures to black and white with this free online tool. Perfect for creating beautiful black and white images.

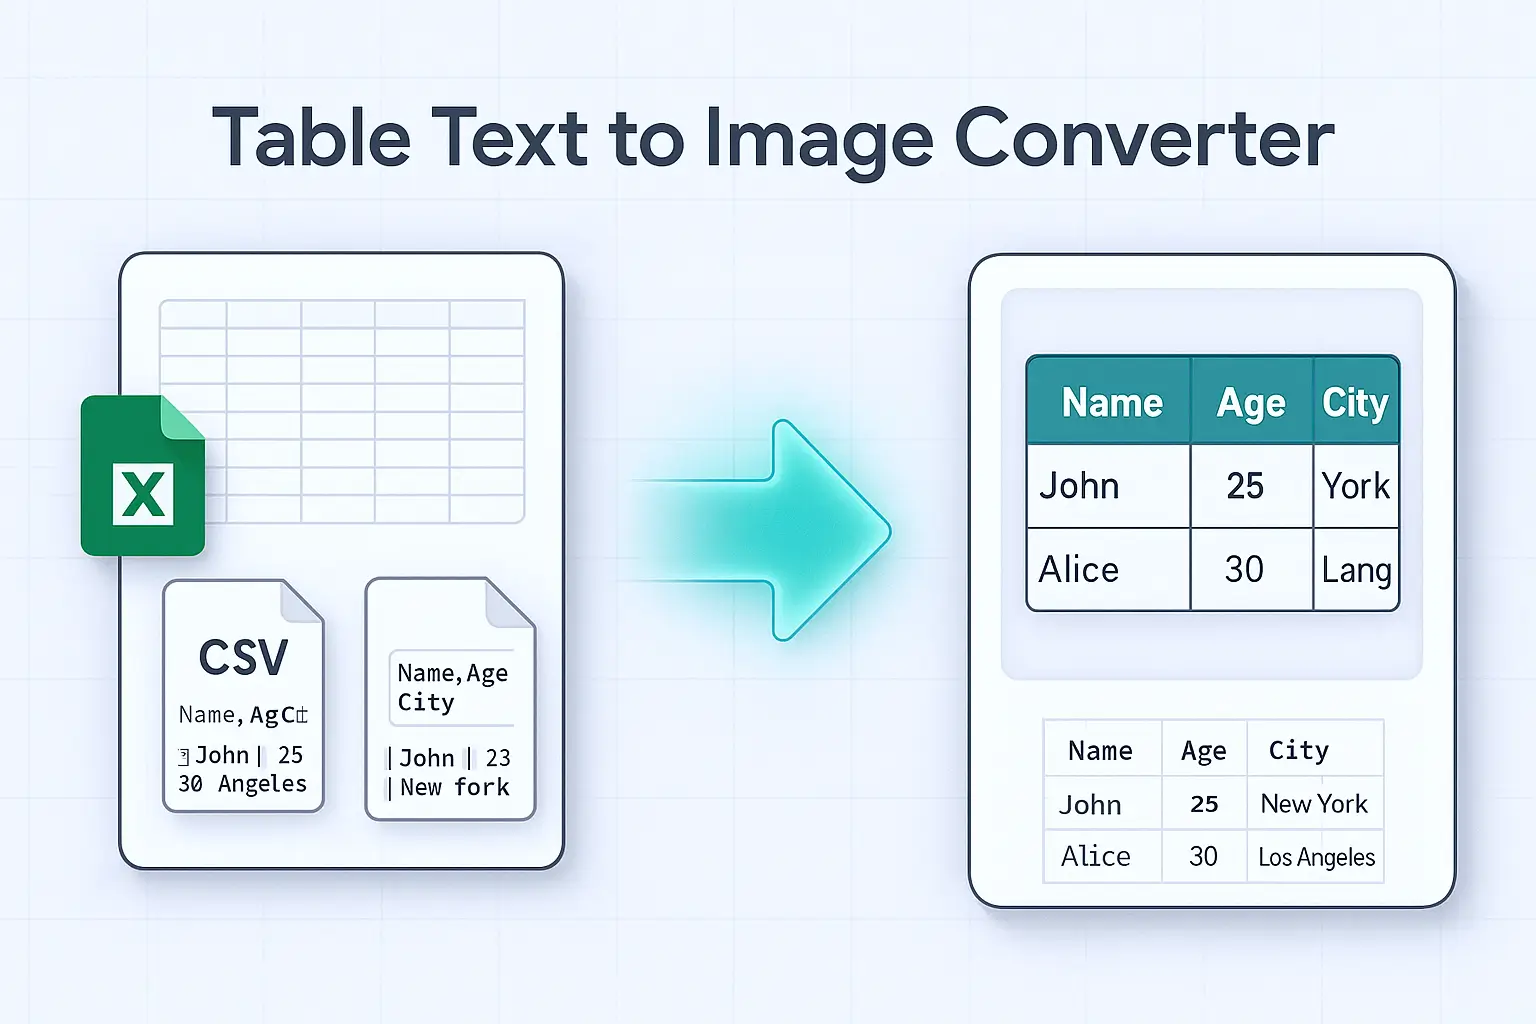
Table Text to Image
Convert text tables to images with this free online tool. Perfect for creating beautiful images of your data.

Shrug Emoji Generator
Generate shrug emoji ¯_(ツ)_/¯ in different fonts and styles.